
Can Mining Policies Equally Benefit Citizens, the Environment and the Energy Transition? (Mining Indaba)
Westin Stage 1, Cape Town International Conference Centre
- Marcus Courage, CEO, Africa Practice (moderator)
- Nere Emiko, Managing Director, Kian Smith Company
- Khalid Koser, Executive Director, GCERF
- Thomas Scurfield, Africa Senior Economic Analyst, NRGI
- H.E. Ruth Nankibirwa Ssetemu, Minister of Energy & Mineral Development, Republic of Uganda
- Tricia Wilhelm, Group Head of Social Impact, Anglo American
- Anselm Wimye, Head of Office, Search for Common Ground
Featuring NRGI's

Thomas Scurfield
Senior Economic Analyst
Notes
-
1
Authors’ analysis based on “Greenhouse Gas Emissions from Energy Data Explorer”, International Energy Agency, 2 August 2023, www.iea.org/data-and-statistics/data-tools/greenhouse-gas-emissions-from-energy-data-explorer. And Hannah Ritchie, Max Roser, and Pablo Rosado, “CO₂ and Greenhouse Gas Emissions,” Our World in Data, 2020, ourworldindata.org/co2-and-greenhouse-gas-emissions.
-
2
Authors’ calculations based on Hannah Ritchie, Pablo Rosado, and Max Roser, “Greenhouse Gas Emissions,” Our World in Data, 2020. And “Oil and Natural Gas Supply,” IEA, 2022, www.iea.org/reports/oil-and-natural-gas-supply. Quoted in African Natural Resources Management and Investment Centre, Minimising Greenhouse Gas Emissions in the Petroleum Sector: The Opportunity for Emerging Producers (Abidjan, Côte d’Ivoire: African Development Bank, 2022), 14, www.newproducersgroup.online/wp-content/uploads/2022/11/Minimising-Greenhouse-Gas-Emissions-in-the-Petroleum-Sector.pdf.
-
3
In order to ensure greater international equity in the energy transition, authorities in countries implementing schemes such as the EU’s CBAM should include, in or alongside such schemes, measures to mitigate their negative effects on low and middle-income countries, e.g., through financial and/or technical assistance to help such countries green their economies.
-
4
Methane is a common by-product of oil extraction and a particularly potent greenhouse gas. In the process of getting oil and gas out of the ground, it is commonly emitted either through leaks or planned release into the atmosphere – either unburned (“venting”) or burned (“flaring”). Processing (e.g., refining) and transporting oil and gas also generate significant emissions. See “Methane from Oil and Gas Production Explained,” The World Bank - Global Gas Flaring Reduction Partnership, accessed 24 October 2023, www.worldbank.org/en/programs/gasflaringreduction/methane-explained.
-
5
The Global Registry of Fossil Fuels is an “[O]pen-source database of oil, gas and coal production and reserves globally, expressed in CO2-equivalent… It contains data from 139 fossil fuel producing countries, which amounts to 99% of fossil fuel production aggregated to the national level.” The database also provides estimates of the emissions from producing oil and gas in 91 oil producing countries and 71 gas producers. See “Global Registry of Fossil Fuel Emissions and Reserves”, Global Registry of Fossil Fuels, accessed 4 September 2023, fossilfuelregistry.org.
-
6
Figures 1 and 2 show a selection of countries, including some of the world’s larger oil producers, some of the world’s lower emitting producers as well as a selection of countries where NRGI operates. This is intended to provide reference points to explore whether individual countries will be more or less “carbon-competitive” than other producers based on current intensities and identifying potential examples of good practice among lower emitting producers. We also include a selection of higher-emitting producers, which may provide examples of practices to avoid.
-
7
Source: “Carbon Intensity in the Fossil Fuel Supply Chain”, Global Registry of Fossil Fuels, 2023, fossilfuelregistry.org/carbon-intensity. Global Warming Potential (GWP) 20 is applied to methane emissions; see “Methane and Climate Change,” IEA, accessed 4 September 2023, www.iea.org/reports/methane-tracker-2021/methane-and-climate-change. The impact would be smaller if we used Global Warming Potential 100. The impact over the next 20 years is important and sufficient to justify action on cutting upstream emissions (and using GWP 100 would fail to show this); this is why we have chosen to display GWP 20 in this figure and figure 2. For further discussion, see Janos Maté and David Kanter, “The Benefits of Basing Policies on the 20 Year GWP of HFCs” (Greenpeace, 2011), ozone.unep.org/system/files/documents/Benefits%20of%20Basing%20Policies%20on%2020%20GWP%20of%20HFCs.pdf.
-
8
The world’s largest oil producers are the United States (accounting for 21 percent of global production), Saudi Arabia (13 percent) and Russia (10 percent). See “Frequently Asked Questions (FAQs) - What Countries Are the Top Producers and Consumers of Oil?”, U.S. Energy Information Administration (EIA), 22 September 2023, www.eia.gov/tools/faqs/faq.php?id=709&t=6.
-
9
Source: “Carbon Intensity in the Fossil Fuel Supply Chain.”
-
10
The world’s largest (fossil) gas producers are the United States (accounting for 25 percent of production), Russia (17 percent) and Iran (6 percent). See “Natural Gas Production”, Enerdata World Energy & Climate Statistics - Yearbook 2023, accessed 4 September 2023, www.doi.org/yearbook.enerdata.net/natural-gas/world-natural-gas-production-statistics.html. And Statista Research Department, “Natural Gas Production Worldwide from 1998 to 2022”, Statista, 29 August 2023, www.statista.com/statistics/265344/total-global-natural-gas-production-since-1998.
-
11
RMI provides data on supply chain emissions by oil and gas project. See RMI, “Assessing Global Oil and Gas Emissions”, Oil Climate Index plus Gas, 2023, ociplus.rmi.org.
-
12
Some initiatives to capture methane emissions can have a positive net present value for companies. See Chantal Beck et al., “The Future of Oil and Gas Is Now: How Companies Can Decarbonize,” McKinsey & Company, 7 January 2020, www.mckinsey.com/industries/oil-and-gas/our-insights/the-future-is-now-how-oil-and-gas-companies-can-decarbonize.
-
13
Authors’ calculations based on Tomas de Oliveira Bredariol and Christophe McGlade, “Fossil Fuels,” IEA, 11 July 2023, www.iea.org/energy-system/fossil-fuels. And Tomas de Oliveira Bredariol and Christophe McGlade, “Gas Flaring,” IEA, accessed 15 September 2023, www.iea.org/energy-system/fossil-fuels/gas-flaring.
-
14
This is a 30 percent cut relative to 2020 levels.
-
15
Authors’ analysis based on Rebecca Schulz, Christophe McGlade, and Peter Zeniewski, “Putting Gas Flaring in the Spotlight,” IEA, 9 December 2020, www.iea.org/commentaries/putting-gas-flaring-in-the-spotlight. And “Nigeria,” The World Bank, June 2022, flaringventingregulations.worldbank.org/nigeria.
-
16
In 2022 Nigeria’s government “[I[ssued guidelines to support the elimination of routine gas flaring by 2030 and a 60 percent reduction in fugitive methane emissions by 2031.” “Methane Abatement,” IEA, accessed 2 October 2023, www.iea.org/energy-system/fossil-fuels/methane-abatement.
State Oil Companies Betting Billions Against the UAE Consensus

After the COP28 UN climate conference in Dubai unprecedented attention has finally landed on the hidden half of the world’s oil and gas industry: national oil companies (NOCs). These state companies produce half the world’s oil and gas, yet their finances and operations are often hidden from the view of their countries’ own citizens.
Bringing to light and engaging with the operations of NOCs is now crucial and urgent. The landmark agreement by 195 countries in Dubai—the “UAE Consensus”— calls for a “transition away from fossil fuels.” Having slow-walked climate action for decades, the richest and most polluting countries have left the global carbon budget so tight that even NOCs in the poorest countries have little time to transition.
(Meanwhile NOCs’ efforts to reduce carbon and methane pollution from the production of oil and gas are insufficient. The Oil and Gas Decarbonization Charter announced in the early days of COP28 falls well short of what is needed to reach the Paris Agreement goals.)
The COP decision sends a clear message to national oil companies and their governments: look to a greener future. Instead NOCs are on course to spend $1.8 trillion in the coming decade to produce fossil fuels. This is mostly public money funding oil and gas in amounts far beyond levels consistent with a 1.5C upper temperature increase limit.
In essence, this money is a big bet that energy transition fails. More than two-thirds—$1.2 trillion—of this spending will only break even if the world consumes oil and gas at a rate that will cause catastrophic climate change. Not only does the UAE Consensus make this bet look riskier but governments with shrinking pockets will be less able to bail out NOCs whose bets turn bad. Across countries with NOCs, the average government debt as a proportion of gross domestic product doubled between 2011 and 2021.
How might NOCs and their governments respond? They must first recognize that there can be no more business as usual. Either the global transition fails to meet the UAE Consensus and the resulting climate crisis hits hard, or the transition erodes fossil fuel demand on which these countries depend.
From there, they should assess how their strategies will fare in a range of energy transition scenarios. How would revenue shortfalls affect the economic health of their countries? Saudi Aramco and ADNOC enjoy plentiful, low-cost oil that positions them to be among the “last producers standing.” But most NOCs don’t.
Where profit hinges on global climate inaction, NOCs must pursue new pathways or right-size their spending plans; and if they don’t or can’t, their governments should tighten the reins.
Before COP28, we examined the public statements of 21 leading NOCs and found that more than half hadn’t even acknowledged the threat of the global energy transition to their business models and the fiscal well-being of their countries. And fewer than a quarter had articulated plans to mitigate this risk. The global call to transition away from fossil fuels may now change these attitudes.
Amid a largely discouraging picture, some positive examples stand out. Colombia’s Ecopetrol has disclosed a detailed analysis of transition risk and the use of risk assessment tools. This is bold—the company’s portfolio relies heavily on high-cost oil that won’t make economic sense in a greener future—but acknowledging risk and identifying options are the first steps to progress.
Yet with few obvious options for replacing the revenues and energy that oil and gas bring, political leaders and NOC executives in such countries will likely remain hooked on hydrocarbons. They need support to take these steps.
NOCs and their governments—especially the lowest-income producers with the least ability to transition their economies on their own—shouldn’t bear the whole burden of transition. Wealthy, heavily polluting countries should be the first and fastest to phase out their production—and to finance transition in lower-income countries where citizens disproportionately suffer climate impacts and have contributed far less to warming. Without concrete commitments by wealthy countries on this front, the call for a “just and equitable” transition in the UAE Consensus risks falling flat.
The UAE Consensus requires both NOCs and the international community to respond, and to do so in this crucial decade.
National oil companies are making risky bets amid the energy transition
Notes
-
1
Authors’ analysis based on “Greenhouse Gas Emissions from Energy Data Explorer”, International Energy Agency, 2 August 2023, www.iea.org/data-and-statistics/data-tools/greenhouse-gas-emissions-from-energy-data-explorer. And Hannah Ritchie, Max Roser, and Pablo Rosado, “CO₂ and Greenhouse Gas Emissions,” Our World in Data, 2020, ourworldindata.org/co2-and-greenhouse-gas-emissions.
-
2
Authors’ calculations based on Hannah Ritchie, Pablo Rosado, and Max Roser, “Greenhouse Gas Emissions,” Our World in Data, 2020. And “Oil and Natural Gas Supply,” IEA, 2022, www.iea.org/reports/oil-and-natural-gas-supply. Quoted in African Natural Resources Management and Investment Centre, Minimising Greenhouse Gas Emissions in the Petroleum Sector: The Opportunity for Emerging Producers (Abidjan, Côte d’Ivoire: African Development Bank, 2022), 14, www.newproducersgroup.online/wp-content/uploads/2022/11/Minimising-Greenhouse-Gas-Emissions-in-the-Petroleum-Sector.pdf.
-
3
In order to ensure greater international equity in the energy transition, authorities in countries implementing schemes such as the EU’s CBAM should include, in or alongside such schemes, measures to mitigate their negative effects on low and middle-income countries, e.g., through financial and/or technical assistance to help such countries green their economies.
-
4
Methane is a common by-product of oil extraction and a particularly potent greenhouse gas. In the process of getting oil and gas out of the ground, it is commonly emitted either through leaks or planned release into the atmosphere – either unburned (“venting”) or burned (“flaring”). Processing (e.g., refining) and transporting oil and gas also generate significant emissions. See “Methane from Oil and Gas Production Explained,” The World Bank - Global Gas Flaring Reduction Partnership, accessed 24 October 2023, www.worldbank.org/en/programs/gasflaringreduction/methane-explained.
-
5
The Global Registry of Fossil Fuels is an “[O]pen-source database of oil, gas and coal production and reserves globally, expressed in CO2-equivalent… It contains data from 139 fossil fuel producing countries, which amounts to 99% of fossil fuel production aggregated to the national level.” The database also provides estimates of the emissions from producing oil and gas in 91 oil producing countries and 71 gas producers. See “Global Registry of Fossil Fuel Emissions and Reserves”, Global Registry of Fossil Fuels, accessed 4 September 2023, fossilfuelregistry.org.
-
6
Figures 1 and 2 show a selection of countries, including some of the world’s larger oil producers, some of the world’s lower emitting producers as well as a selection of countries where NRGI operates. This is intended to provide reference points to explore whether individual countries will be more or less “carbon-competitive” than other producers based on current intensities and identifying potential examples of good practice among lower emitting producers. We also include a selection of higher-emitting producers, which may provide examples of practices to avoid.
-
7
Source: “Carbon Intensity in the Fossil Fuel Supply Chain”, Global Registry of Fossil Fuels, 2023, fossilfuelregistry.org/carbon-intensity. Global Warming Potential (GWP) 20 is applied to methane emissions; see “Methane and Climate Change,” IEA, accessed 4 September 2023, www.iea.org/reports/methane-tracker-2021/methane-and-climate-change. The impact would be smaller if we used Global Warming Potential 100. The impact over the next 20 years is important and sufficient to justify action on cutting upstream emissions (and using GWP 100 would fail to show this); this is why we have chosen to display GWP 20 in this figure and figure 2. For further discussion, see Janos Maté and David Kanter, “The Benefits of Basing Policies on the 20 Year GWP of HFCs” (Greenpeace, 2011), ozone.unep.org/system/files/documents/Benefits%20of%20Basing%20Policies%20on%2020%20GWP%20of%20HFCs.pdf.
-
8
The world’s largest oil producers are the United States (accounting for 21 percent of global production), Saudi Arabia (13 percent) and Russia (10 percent). See “Frequently Asked Questions (FAQs) - What Countries Are the Top Producers and Consumers of Oil?”, U.S. Energy Information Administration (EIA), 22 September 2023, www.eia.gov/tools/faqs/faq.php?id=709&t=6.
-
9
Source: “Carbon Intensity in the Fossil Fuel Supply Chain.”
-
10
The world’s largest (fossil) gas producers are the United States (accounting for 25 percent of production), Russia (17 percent) and Iran (6 percent). See “Natural Gas Production”, Enerdata World Energy & Climate Statistics - Yearbook 2023, accessed 4 September 2023, www.doi.org/yearbook.enerdata.net/natural-gas/world-natural-gas-production-statistics.html. And Statista Research Department, “Natural Gas Production Worldwide from 1998 to 2022”, Statista, 29 August 2023, www.statista.com/statistics/265344/total-global-natural-gas-production-since-1998.
-
11
RMI provides data on supply chain emissions by oil and gas project. See RMI, “Assessing Global Oil and Gas Emissions”, Oil Climate Index plus Gas, 2023, ociplus.rmi.org.
-
12
Some initiatives to capture methane emissions can have a positive net present value for companies. See Chantal Beck et al., “The Future of Oil and Gas Is Now: How Companies Can Decarbonize,” McKinsey & Company, 7 January 2020, www.mckinsey.com/industries/oil-and-gas/our-insights/the-future-is-now-how-oil-and-gas-companies-can-decarbonize.
-
13
Authors’ calculations based on Tomas de Oliveira Bredariol and Christophe McGlade, “Fossil Fuels,” IEA, 11 July 2023, www.iea.org/energy-system/fossil-fuels. And Tomas de Oliveira Bredariol and Christophe McGlade, “Gas Flaring,” IEA, accessed 15 September 2023, www.iea.org/energy-system/fossil-fuels/gas-flaring.
-
14
This is a 30 percent cut relative to 2020 levels.
-
15
Authors’ analysis based on Rebecca Schulz, Christophe McGlade, and Peter Zeniewski, “Putting Gas Flaring in the Spotlight,” IEA, 9 December 2020, www.iea.org/commentaries/putting-gas-flaring-in-the-spotlight. And “Nigeria,” The World Bank, June 2022, flaringventingregulations.worldbank.org/nigeria.
-
16
In 2022 Nigeria’s government “[I[ssued guidelines to support the elimination of routine gas flaring by 2030 and a 60 percent reduction in fugitive methane emissions by 2031.” “Methane Abatement,” IEA, accessed 2 October 2023, www.iea.org/energy-system/fossil-fuels/methane-abatement.
Addressing Governance and Corruption Challenges in the Response to Climate Change (COP28 Blue Zone Event)

Investing in climate change resilience requires large scale financing. The potential for corruption to exacerbate the challenge, undermine the effectiveness of the response and increase costs means that better governance must be at the heart of the climate response. Acting fast will mean leveraging the existing anticorruption architecture and catalyzing coalitions in a highly coordinated way. In this joint event with the World Bank, panelists discussed corruption vulnerabilities that are specific to the green transition and how to address them.
Panelists
- Shuang Liu, World Resources Institute, China Finance Director
- Tsakani Maluleke, South Africa, Auditor-General
- Mark Robinson, Extractive Industries Transparency Initiative, Executive Director
Moderator
- Laury Haytayan, Natural Resource Governance Institute, MENA Director

Laury Haytayan
Middle East and North Africa Director
Notes
-
1
Authors’ analysis based on “Greenhouse Gas Emissions from Energy Data Explorer”, International Energy Agency, 2 August 2023, www.iea.org/data-and-statistics/data-tools/greenhouse-gas-emissions-from-energy-data-explorer. And Hannah Ritchie, Max Roser, and Pablo Rosado, “CO₂ and Greenhouse Gas Emissions,” Our World in Data, 2020, ourworldindata.org/co2-and-greenhouse-gas-emissions.
-
2
Authors’ calculations based on Hannah Ritchie, Pablo Rosado, and Max Roser, “Greenhouse Gas Emissions,” Our World in Data, 2020. And “Oil and Natural Gas Supply,” IEA, 2022, www.iea.org/reports/oil-and-natural-gas-supply. Quoted in African Natural Resources Management and Investment Centre, Minimising Greenhouse Gas Emissions in the Petroleum Sector: The Opportunity for Emerging Producers (Abidjan, Côte d’Ivoire: African Development Bank, 2022), 14, www.newproducersgroup.online/wp-content/uploads/2022/11/Minimising-Greenhouse-Gas-Emissions-in-the-Petroleum-Sector.pdf.
-
3
In order to ensure greater international equity in the energy transition, authorities in countries implementing schemes such as the EU’s CBAM should include, in or alongside such schemes, measures to mitigate their negative effects on low and middle-income countries, e.g., through financial and/or technical assistance to help such countries green their economies.
-
4
Methane is a common by-product of oil extraction and a particularly potent greenhouse gas. In the process of getting oil and gas out of the ground, it is commonly emitted either through leaks or planned release into the atmosphere – either unburned (“venting”) or burned (“flaring”). Processing (e.g., refining) and transporting oil and gas also generate significant emissions. See “Methane from Oil and Gas Production Explained,” The World Bank - Global Gas Flaring Reduction Partnership, accessed 24 October 2023, www.worldbank.org/en/programs/gasflaringreduction/methane-explained.
-
5
The Global Registry of Fossil Fuels is an “[O]pen-source database of oil, gas and coal production and reserves globally, expressed in CO2-equivalent… It contains data from 139 fossil fuel producing countries, which amounts to 99% of fossil fuel production aggregated to the national level.” The database also provides estimates of the emissions from producing oil and gas in 91 oil producing countries and 71 gas producers. See “Global Registry of Fossil Fuel Emissions and Reserves”, Global Registry of Fossil Fuels, accessed 4 September 2023, fossilfuelregistry.org.
-
6
Figures 1 and 2 show a selection of countries, including some of the world’s larger oil producers, some of the world’s lower emitting producers as well as a selection of countries where NRGI operates. This is intended to provide reference points to explore whether individual countries will be more or less “carbon-competitive” than other producers based on current intensities and identifying potential examples of good practice among lower emitting producers. We also include a selection of higher-emitting producers, which may provide examples of practices to avoid.
-
7
Source: “Carbon Intensity in the Fossil Fuel Supply Chain”, Global Registry of Fossil Fuels, 2023, fossilfuelregistry.org/carbon-intensity. Global Warming Potential (GWP) 20 is applied to methane emissions; see “Methane and Climate Change,” IEA, accessed 4 September 2023, www.iea.org/reports/methane-tracker-2021/methane-and-climate-change. The impact would be smaller if we used Global Warming Potential 100. The impact over the next 20 years is important and sufficient to justify action on cutting upstream emissions (and using GWP 100 would fail to show this); this is why we have chosen to display GWP 20 in this figure and figure 2. For further discussion, see Janos Maté and David Kanter, “The Benefits of Basing Policies on the 20 Year GWP of HFCs” (Greenpeace, 2011), ozone.unep.org/system/files/documents/Benefits%20of%20Basing%20Policies%20on%2020%20GWP%20of%20HFCs.pdf.
-
8
The world’s largest oil producers are the United States (accounting for 21 percent of global production), Saudi Arabia (13 percent) and Russia (10 percent). See “Frequently Asked Questions (FAQs) - What Countries Are the Top Producers and Consumers of Oil?”, U.S. Energy Information Administration (EIA), 22 September 2023, www.eia.gov/tools/faqs/faq.php?id=709&t=6.
-
9
Source: “Carbon Intensity in the Fossil Fuel Supply Chain.”
-
10
The world’s largest (fossil) gas producers are the United States (accounting for 25 percent of production), Russia (17 percent) and Iran (6 percent). See “Natural Gas Production”, Enerdata World Energy & Climate Statistics - Yearbook 2023, accessed 4 September 2023, www.doi.org/yearbook.enerdata.net/natural-gas/world-natural-gas-production-statistics.html. And Statista Research Department, “Natural Gas Production Worldwide from 1998 to 2022”, Statista, 29 August 2023, www.statista.com/statistics/265344/total-global-natural-gas-production-since-1998.
-
11
RMI provides data on supply chain emissions by oil and gas project. See RMI, “Assessing Global Oil and Gas Emissions”, Oil Climate Index plus Gas, 2023, ociplus.rmi.org.
-
12
Some initiatives to capture methane emissions can have a positive net present value for companies. See Chantal Beck et al., “The Future of Oil and Gas Is Now: How Companies Can Decarbonize,” McKinsey & Company, 7 January 2020, www.mckinsey.com/industries/oil-and-gas/our-insights/the-future-is-now-how-oil-and-gas-companies-can-decarbonize.
-
13
Authors’ calculations based on Tomas de Oliveira Bredariol and Christophe McGlade, “Fossil Fuels,” IEA, 11 July 2023, www.iea.org/energy-system/fossil-fuels. And Tomas de Oliveira Bredariol and Christophe McGlade, “Gas Flaring,” IEA, accessed 15 September 2023, www.iea.org/energy-system/fossil-fuels/gas-flaring.
-
14
This is a 30 percent cut relative to 2020 levels.
-
15
Authors’ analysis based on Rebecca Schulz, Christophe McGlade, and Peter Zeniewski, “Putting Gas Flaring in the Spotlight,” IEA, 9 December 2020, www.iea.org/commentaries/putting-gas-flaring-in-the-spotlight. And “Nigeria,” The World Bank, June 2022, flaringventingregulations.worldbank.org/nigeria.
-
16
In 2022 Nigeria’s government “[I[ssued guidelines to support the elimination of routine gas flaring by 2030 and a 60 percent reduction in fugitive methane emissions by 2031.” “Methane Abatement,” IEA, accessed 2 October 2023, www.iea.org/energy-system/fossil-fuels/methane-abatement.
The Energy Transition: Supply, Demand and the Investor Perspective (COP28 Blue Zone Event)
Against the backdrop of an escalating climate crisis and the need to fund an accelerated energy transition, this session will showcase supply-side and demand-side themes, as well as consider them through an investor/stakeholder lens.
Speakers will include:
- Mike Coffin, Head of Oil, Gas & Mining, Carbon Tracker
- Richard Folland, Head of Policy and Engagement, Carbon Tracker
- Denis Gyeyir, Senior Africa Analyst, NRGI
- Ben Scott, Senior Automotive Analyst, Carbon Tracker
- Representatives of Powershift Africa, EITI and UNEP-FI
Featuring NRGI's

Notes
-
1
Authors’ analysis based on “Greenhouse Gas Emissions from Energy Data Explorer”, International Energy Agency, 2 August 2023, www.iea.org/data-and-statistics/data-tools/greenhouse-gas-emissions-from-energy-data-explorer. And Hannah Ritchie, Max Roser, and Pablo Rosado, “CO₂ and Greenhouse Gas Emissions,” Our World in Data, 2020, ourworldindata.org/co2-and-greenhouse-gas-emissions.
-
2
Authors’ calculations based on Hannah Ritchie, Pablo Rosado, and Max Roser, “Greenhouse Gas Emissions,” Our World in Data, 2020. And “Oil and Natural Gas Supply,” IEA, 2022, www.iea.org/reports/oil-and-natural-gas-supply. Quoted in African Natural Resources Management and Investment Centre, Minimising Greenhouse Gas Emissions in the Petroleum Sector: The Opportunity for Emerging Producers (Abidjan, Côte d’Ivoire: African Development Bank, 2022), 14, www.newproducersgroup.online/wp-content/uploads/2022/11/Minimising-Greenhouse-Gas-Emissions-in-the-Petroleum-Sector.pdf.
-
3
In order to ensure greater international equity in the energy transition, authorities in countries implementing schemes such as the EU’s CBAM should include, in or alongside such schemes, measures to mitigate their negative effects on low and middle-income countries, e.g., through financial and/or technical assistance to help such countries green their economies.
-
4
Methane is a common by-product of oil extraction and a particularly potent greenhouse gas. In the process of getting oil and gas out of the ground, it is commonly emitted either through leaks or planned release into the atmosphere – either unburned (“venting”) or burned (“flaring”). Processing (e.g., refining) and transporting oil and gas also generate significant emissions. See “Methane from Oil and Gas Production Explained,” The World Bank - Global Gas Flaring Reduction Partnership, accessed 24 October 2023, www.worldbank.org/en/programs/gasflaringreduction/methane-explained.
-
5
The Global Registry of Fossil Fuels is an “[O]pen-source database of oil, gas and coal production and reserves globally, expressed in CO2-equivalent… It contains data from 139 fossil fuel producing countries, which amounts to 99% of fossil fuel production aggregated to the national level.” The database also provides estimates of the emissions from producing oil and gas in 91 oil producing countries and 71 gas producers. See “Global Registry of Fossil Fuel Emissions and Reserves”, Global Registry of Fossil Fuels, accessed 4 September 2023, fossilfuelregistry.org.
-
6
Figures 1 and 2 show a selection of countries, including some of the world’s larger oil producers, some of the world’s lower emitting producers as well as a selection of countries where NRGI operates. This is intended to provide reference points to explore whether individual countries will be more or less “carbon-competitive” than other producers based on current intensities and identifying potential examples of good practice among lower emitting producers. We also include a selection of higher-emitting producers, which may provide examples of practices to avoid.
-
7
Source: “Carbon Intensity in the Fossil Fuel Supply Chain”, Global Registry of Fossil Fuels, 2023, fossilfuelregistry.org/carbon-intensity. Global Warming Potential (GWP) 20 is applied to methane emissions; see “Methane and Climate Change,” IEA, accessed 4 September 2023, www.iea.org/reports/methane-tracker-2021/methane-and-climate-change. The impact would be smaller if we used Global Warming Potential 100. The impact over the next 20 years is important and sufficient to justify action on cutting upstream emissions (and using GWP 100 would fail to show this); this is why we have chosen to display GWP 20 in this figure and figure 2. For further discussion, see Janos Maté and David Kanter, “The Benefits of Basing Policies on the 20 Year GWP of HFCs” (Greenpeace, 2011), ozone.unep.org/system/files/documents/Benefits%20of%20Basing%20Policies%20on%2020%20GWP%20of%20HFCs.pdf.
-
8
The world’s largest oil producers are the United States (accounting for 21 percent of global production), Saudi Arabia (13 percent) and Russia (10 percent). See “Frequently Asked Questions (FAQs) - What Countries Are the Top Producers and Consumers of Oil?”, U.S. Energy Information Administration (EIA), 22 September 2023, www.eia.gov/tools/faqs/faq.php?id=709&t=6.
-
9
Source: “Carbon Intensity in the Fossil Fuel Supply Chain.”
-
10
The world’s largest (fossil) gas producers are the United States (accounting for 25 percent of production), Russia (17 percent) and Iran (6 percent). See “Natural Gas Production”, Enerdata World Energy & Climate Statistics - Yearbook 2023, accessed 4 September 2023, www.doi.org/yearbook.enerdata.net/natural-gas/world-natural-gas-production-statistics.html. And Statista Research Department, “Natural Gas Production Worldwide from 1998 to 2022”, Statista, 29 August 2023, www.statista.com/statistics/265344/total-global-natural-gas-production-since-1998.
-
11
RMI provides data on supply chain emissions by oil and gas project. See RMI, “Assessing Global Oil and Gas Emissions”, Oil Climate Index plus Gas, 2023, ociplus.rmi.org.
-
12
Some initiatives to capture methane emissions can have a positive net present value for companies. See Chantal Beck et al., “The Future of Oil and Gas Is Now: How Companies Can Decarbonize,” McKinsey & Company, 7 January 2020, www.mckinsey.com/industries/oil-and-gas/our-insights/the-future-is-now-how-oil-and-gas-companies-can-decarbonize.
-
13
Authors’ calculations based on Tomas de Oliveira Bredariol and Christophe McGlade, “Fossil Fuels,” IEA, 11 July 2023, www.iea.org/energy-system/fossil-fuels. And Tomas de Oliveira Bredariol and Christophe McGlade, “Gas Flaring,” IEA, accessed 15 September 2023, www.iea.org/energy-system/fossil-fuels/gas-flaring.
-
14
This is a 30 percent cut relative to 2020 levels.
-
15
Authors’ analysis based on Rebecca Schulz, Christophe McGlade, and Peter Zeniewski, “Putting Gas Flaring in the Spotlight,” IEA, 9 December 2020, www.iea.org/commentaries/putting-gas-flaring-in-the-spotlight. And “Nigeria,” The World Bank, June 2022, flaringventingregulations.worldbank.org/nigeria.
-
16
In 2022 Nigeria’s government “[I[ssued guidelines to support the elimination of routine gas flaring by 2030 and a 60 percent reduction in fugitive methane emissions by 2031.” “Methane Abatement,” IEA, accessed 2 October 2023, www.iea.org/energy-system/fossil-fuels/methane-abatement.
Extracting Emissions: Why Resource-Rich Countries Should Cut Emissions from Extractive Operations

-
Global efforts to mitigate climate change are likely to greatly reduce demand for fossil fuels over time. Countries that depend on revenues from these resources should diversify their economies.
-
Investors and customers are pressuring the oil, gas and mining industries to cut greenhouse gas emissions from their production processes. This trend is likely to intensify, including with new policies from key trading partners seeking to reduce greenhouse gas emissions from the extractive commodities that they import. Examples of such measures include the European Union’s Carbon Border Adjustment Mechanism and its regulations on methane emissions from oil, gas and coal operations.
-
To stay competitive, governments of resource-rich countries will need to cut emissions from oil, gas and mining operations in their territories. Some are already doing this. But progress has been slow, and much work remains. To improve results, a wider set of stakeholders than just governments and including civil society actors should engage on the issue and seek increased transparency and accountability on emissions from the extractive industries.
Introduction
On 1 October 2023, the European Union launched the transitional phase of its “Carbon Border Adjustment Mechanism” (CBAM) through which the EU will tax products of the most polluting industries coming into the EU in proportion to greenhouse gas emissions involved in their manufacture. While the CBAM doesn’t yet apply to raw extractive commodities, it does apply to processed metals and mineral products such as aluminum, cement, fertilizer, iron and steel. And the EU is considering extending the CBAM to cover metals more broadly and refined oil by 2030.
The CBAM’s introduction, as well as the EU’s recent announcement that it will regulate methane emissions from oil, gas and coal operations (including in non-EU countries that export to the bloc), is part of a growing trend whereby investors, downstream industries and governments of resource-importing countries pressure the oil, gas and mining sectors to cut emissions from their operations. Here we analyze this trend and how resource-rich countries can respond to it.
We find that countries producing the extractive commodities that pollute the most (whether from extraction, supply chains or final consumption) will find it increasingly difficult to be competitive as the world prioritizes lower-emission varieties. Governments in such countries should therefore analyze emissions from their countries’ extractive operations. Moreover, officials should a) take this into account when deciding whether to invest further public financial resources in these industries given likelihood of decreased demand for high-emission commodities, and b) cut emissions from the production process as this will be an important factor in the economics of extraction going forward.
Climate change mitigation and resource-rich countries’ economic models
The extractive industries and the commodities that they produce are the main contributors to climate change. The use of mined products, especially the burning of coal, including by the extractive industries themselves, accounts for 28 percent of global greenhouse gas emissions; and burning oil and gas accounts for around 33 percent of total emissions.1
Cutting the use of fossil fuels is therefore essential to fighting climate change and efforts to do so will likely have major impacts on fossil fuel producing countries in the medium to long term. If countries follow through on pledges to cut greenhouse gas emissions, this will mean that oil, gas and coal demand will fall, posing problems for resource-rich countries where economic models depend on the production of fossil fuels. Indeed, many analysts think that global oil demand has already peaked. These dynamics make it imperative for fossil fuel producing countries to diversify their economies.
But demand for and production of fossil fuels is not disappearing overnight, and their climate impact is not limited to their end use. Producing, processing and transporting oil and gas (i.e., the sector’s scope 1 and 2 emissions) accounts for 10-13 percent of worldwide greenhouse gas emissions2 (compared to 2-3 percent from mining). Fossil fuel producers are therefore also under pressure to cut emissions from the production and supply of fossil fuels.
What are scope 1, 2 and 3 emissions?
The three different “scopes” relate to the different ways that extractive companies (or a specific project or the sector more broadly) can cause greenhouse gas emissions.
- “Scope 1” emissions are those that the company causes directly, e.g., through burning fossil fuels or failing to stop leaks of greenhouse gases from its infrastructure.
- “Scope 2” emissions are those that the company causes indirectly through purchases of electricity, steam, heat or cooling (e.g., they could come from fossil fuels that were burned to produce electricity that the company purchases).
- “Scope 3” are the emissions caused by the use of the products and services that the company sells to others. For an oil company, this would include the emissions caused by eventual burning of the fuel produced by the oil company, e.g., in a car or airplane.
Impacts of increasing carbon prices on producing countries
Across the world, governments, customers and investors are all increasing pressure on the extractive industries to reduce emissions from their operations and from their products. These efforts include the rise of carbon pricing, through which governments apply financial penalties to companies/individuals for their greenhouse gas emissions , and discourage the use of fossil fuels. For example, from 2018 to 2021, countries accounting for 80 percent of global energy use increased their average carbon price by around 17 percent. And World Bank data suggest that carbon prices increased further in 2021 and 2022.
This continues a long-term trend. From 2012 to 2018, carbon prices and the share of emissions that they covered had also increased. And an increasing number of countries (e.g., Canada, Norway, EU members) plan to bring in new carbon prices, or increase existing ones. As noted above, the EU’s CBAM even extends the EU’s carbon prices to cover emissions that occurred outside the EU during the production of the bloc’s imports of certain products. This could leave mineral-rich countries exporting to the EU worse off. As one of us has argued elsewhere, such countries should consider implementing their own carbon prices, both for the wider benefits they carry and to eliminate or reduce payments to the EU under the CBAM and potentially under the similar schemes being considered by Canada, the U.K. and the U.S. (though not necessarily with the same sectoral coverage).3
Increased carbon prices could further reduce demand for fossil fuels, leading to a lower market price which in turn could make many oil and gas projects unprofitable. Higher carbon prices will put most pressure on producers of the dirtiest fuels—coal, but also heavier, more carbon-rich oils, the burning of which generates the most emissions, requiring the highest payments of carbon prices, when compared with other fuels. Extra-heavy oils are estimated to emit at least 24 percent more CO2 when burned than light oils. Projects that are both high-cost (meaning that the commodity costs more per unit to extract) and highly carbon-intensive may struggle to be competitive in the future. Governments should therefore be wary of investing public money into development of such projects.
Importance of reducing emissions from extractive operations for future investment and revenues
While measures in extractives-importing countries such as the EU’s CBAM do not currently target emissions from the process of getting the imported oil, gas and minerals out of the ground in the first place. this could soon change. For example, the International Energy Agency and the OECD have called for fossil fuel importing countries to adopt standards on leaks of methane from extraction of the oil and gas that they import.4
The European Union has decided to leverage its position as the largest importer of oil and gas to reduce supply chain emissions of methane from the fossil fuels that the bloc imports. To do so, it will oblige countries from which it imports oil, gas and coal to apply the same monitoring, reporting and verification requirements that fossil fuel producers inside the bloc will have to meet. The European Union will also set a maximum methane emission intensity to the oil, gas and coal that it uses starting in 2030. EU member states will have the power to fine importers who do not respect these limits and monitoring, reporting and verificaiton measures. The bloc is also looking to coordinate this approach to methane emissions with other fossil fuel importers. Such approaches could make it harder for producers with the highest levels of methane leaks to achieve a high market price for their fossil fuel exports (unless they are able to reduce these leaks). Governments in producing countries should act to cut emissions from their extractive industries now, instead of leaving it too late and seeing exports suffer once importing countries implement such measures and producers scramble to make changes.
Similarly, investors and customers are pressuring the extractive industries to clean up or lose business or investment. Analysts consider low-carbon oil, gas and mining projects more likely to receive funding than higher-emission projects. And over the longer term, institutional investors expect high-emission oil and gas projects to no longer be viable. Even though for most countries, the bulk of the emissions from their oil and gas comes from burning the fuels upon end use, differences between countries’ supply chain emissions from producing oil and gas vary significantly, as shown in figures 1 and 2 below.5 ,6 These variations in supply chain emissions can add significantly to total emissions (supply chain plus end use) as well. Based on estimates from the Global Registry of Fossil Fuels, total emissions per barrel of oil from countries with the highest supply-chain emissions (top 25 percent) are over 60 percent higher than oil from countries with the lowest supply-chain emissions (bottom 25 percent). The equivalent figure for gas is over 90 percent.
Figure 1. Estimated emissions from oil supply chains7 ,8

Figure 2. Estimated emissions from gas supply chains9 ,10

NB: Yellow bars indicate countries where NRGI has programs and/or are highlighted for other reasons (see footnote 7 for an explanation).
Emissions can also vary significantly between projects in the same country, so some projects within a country may be “competitive” in terms of emissions, while others are not.11
In some cases, policymakers may be able to close this gap. For example, according to McKinsey, the oil and gas sector can reduce its operational emissions by over half at an average cost of less than $50 per ton of carbon dioxide equivalent in greenhouse gas emissions, which may be commercially viable for many projects. Methane accounts for 46 percent of emissions from oil and gas operations. It can be particularly strategic to focus on cutting methane emissions because of the gas’s potency–over a 20-year time horizon, it warms the climate 80 times as much as CO2. This is especially the case because existing technologies can already cut methane emissions from oil and gas production by 70 percent; and around 40 percent of methane emissions from oil and gas could be cut at no net cost by capturing and selling gas that would otherwise be wasted.12 It is also the main source of greenhouse gas emissions from mining; techniques exist to cut methane emissions from that sector too.
To date, a key issue holding back efforts to cut methane emissions has been that companies have lacked incentives to bring them down; even if the cost of cutting methane emissions can be recouped through savings, the “return on investment” may be insufficient to encourage companies to do so. For projects that are not very profitable and cannot afford to bring operational emissions down from a high level, ceasing production, and international incentives to do so, should also be considered.
Those resource-rich countries that move first and fastest to decarbonize their extractive sectors may acquire an edge. This may be particularly true for those with newer facilities that can be designed for low emissions intensities from the start, rather than having to retrofit old infrastructure. For fossil fuel producers, this may help them to be among the “last producers standing” as the world cuts the use of fossil fuels, with importers buying from those sources with the lowest emissions.
Resource-rich countries’ efforts to decarbonize extractive operations
In response to the dynamics identified above some resource-rich countries are starting to cut emissions from their extractive industries.
For example, one of the main sources of emissions from upstream extractives is gas flaring (see above for an explanation) which accounts for around 10 percent of the total emissions from oil and gas production, processing and transport.13
Colombian national oil company Ecopetrol reduced flaring steadily from 2012 to 2021, achieving an estimated 60 percent reduction in flared gas per barrel produced. Colombia has also adopted a specific regulation to cut methane emissions from the sector in 2022. Governments in 10 of the 12 countries where NRGI operates programming have committed to contribute to cutting global methane emissions by 30 percent by 2030.14 In addition, Mexico committed to spend USD 2 billion to reduce methane emissions from oil and gas exploration by 98 percent. Chile, Colombia and Mexico have also introduced carbon pricing, which should encourage extractive industries to cut the use of fossil fuels in their operations. Companies have also tried to limit the emissions from the planned East Africa Crude Oil Pipeline in Uganda and Tanzania by powering it with solar energy (though substantial environmental issues remain).
Roles for civil society and other stakeholders
Much work remains for those seeking to reduce emissions from extractive industry operations. Notwithstanding various stated commitments of companies and governments, and international pledges of financial and technical support, progress has been slow or otherwise disappointing. For example, in Nigeria, although gas flaring substantially decreased between 2000 and 2012, the level of flaring per barrel of oil produced barely changed after that, despite a commitment from the government in 2016 to eliminate routine flaring by 2030.15 ,16 And as international oil companies sell off their most-polluting assets, these have sometimes been bought by companies with lower environmental standards, leading to higher emissions.
Increased transparency and accountability will be important in ensuring greater engagement with the issue and to push governments, companies and investors to take the necessary action. At the international level, the Extractive Industries Transparency Initiative (EITI) has taken an important step, with the revised EITI Standard encouraging extractive-sector companies to publish project-level greenhouse gas emissions from oil, gas and mining projects. This will help governments and citizens assess which projects are most at risk of becoming uncompetitive due to high emissions and how to respond.
At the national level, more effective engagement by a broader set of actors can “move the needle” on emissions from extractive operations. This engagement will be more likely if stakeholders understand that reducing emissions from extractive sector operations is not just about countering climate change, but also related to other national priorities such as protecting government revenues and reducing harms to the health and environment of local communities. With that orientation, civil society, local community groups and concerned citizens can push governments (and businesses) to sufficiently prioritize emissions minimization, including by strengthening the regulatory framework and its enforcement. Looking beyond climate change at this broader set of reasons to cut extractive sector emissions can also increase civil society interest and capacity to campaign effectively on the issue of extractive sector operations emissions. This broader engagement will be important for resource-rich countries to effectively respond to the increasing challenge to cut emissions from extractive operations.
Acknowledgements
The authors would like to thank Paul Bagabo, Lee Bailey, Fernanda Ballesteros, Tengi George-Ikoli, Antonio Hill, Alexandra Malmqvist, David Manley, Valérie Marcel, Juliana Peña Niño, Rob Pitman, Thomas Scurfield, Ricardo Troncoso, Daniel Wilde and Nicola Woodroffe for very helpful comments.
Notes
-
1
Authors’ analysis based on “Greenhouse Gas Emissions from Energy Data Explorer”, International Energy Agency, 2 August 2023, www.iea.org/data-and-statistics/data-tools/greenhouse-gas-emissions-from-energy-data-explorer. And Hannah Ritchie, Max Roser, and Pablo Rosado, “CO₂ and Greenhouse Gas Emissions,” Our World in Data, 2020, ourworldindata.org/co2-and-greenhouse-gas-emissions.
-
2
Authors’ calculations based on Hannah Ritchie, Pablo Rosado, and Max Roser, “Greenhouse Gas Emissions,” Our World in Data, 2020. And “Oil and Natural Gas Supply,” IEA, 2022, www.iea.org/reports/oil-and-natural-gas-supply. Quoted in African Natural Resources Management and Investment Centre, Minimising Greenhouse Gas Emissions in the Petroleum Sector: The Opportunity for Emerging Producers (Abidjan, Côte d’Ivoire: African Development Bank, 2022), 14, www.newproducersgroup.online/wp-content/uploads/2022/11/Minimising-Greenhouse-Gas-Emissions-in-the-Petroleum-Sector.pdf.
-
3
In order to ensure greater international equity in the energy transition, authorities in countries implementing schemes such as the EU’s CBAM should include, in or alongside such schemes, measures to mitigate their negative effects on low and middle-income countries, e.g., through financial and/or technical assistance to help such countries green their economies.
-
4
Methane is a common by-product of oil extraction and a particularly potent greenhouse gas. In the process of getting oil and gas out of the ground, it is commonly emitted either through leaks or planned release into the atmosphere – either unburned (“venting”) or burned (“flaring”). Processing (e.g., refining) and transporting oil and gas also generate significant emissions. See “Methane from Oil and Gas Production Explained,” The World Bank - Global Gas Flaring Reduction Partnership, accessed 24 October 2023, www.worldbank.org/en/programs/gasflaringreduction/methane-explained.
-
5
The Global Registry of Fossil Fuels is an “[O]pen-source database of oil, gas and coal production and reserves globally, expressed in CO2-equivalent… It contains data from 139 fossil fuel producing countries, which amounts to 99% of fossil fuel production aggregated to the national level.” The database also provides estimates of the emissions from producing oil and gas in 91 oil producing countries and 71 gas producers. See “Global Registry of Fossil Fuel Emissions and Reserves”, Global Registry of Fossil Fuels, accessed 4 September 2023, fossilfuelregistry.org.
-
6
Figures 1 and 2 show a selection of countries, including some of the world’s larger oil producers, some of the world’s lower emitting producers as well as a selection of countries where NRGI operates. This is intended to provide reference points to explore whether individual countries will be more or less “carbon-competitive” than other producers based on current intensities and identifying potential examples of good practice among lower emitting producers. We also include a selection of higher-emitting producers, which may provide examples of practices to avoid.
-
7
Source: “Carbon Intensity in the Fossil Fuel Supply Chain”, Global Registry of Fossil Fuels, 2023, fossilfuelregistry.org/carbon-intensity. Global Warming Potential (GWP) 20 is applied to methane emissions; see “Methane and Climate Change,” IEA, accessed 4 September 2023, www.iea.org/reports/methane-tracker-2021/methane-and-climate-change. The impact would be smaller if we used Global Warming Potential 100. The impact over the next 20 years is important and sufficient to justify action on cutting upstream emissions (and using GWP 100 would fail to show this); this is why we have chosen to display GWP 20 in this figure and figure 2. For further discussion, see Janos Maté and David Kanter, “The Benefits of Basing Policies on the 20 Year GWP of HFCs” (Greenpeace, 2011), ozone.unep.org/system/files/documents/Benefits%20of%20Basing%20Policies%20on%2020%20GWP%20of%20HFCs.pdf.
-
8
The world’s largest oil producers are the United States (accounting for 21 percent of global production), Saudi Arabia (13 percent) and Russia (10 percent). See “Frequently Asked Questions (FAQs) - What Countries Are the Top Producers and Consumers of Oil?”, U.S. Energy Information Administration (EIA), 22 September 2023, www.eia.gov/tools/faqs/faq.php?id=709&t=6.
-
9
Source: “Carbon Intensity in the Fossil Fuel Supply Chain.”
-
10
The world’s largest (fossil) gas producers are the United States (accounting for 25 percent of production), Russia (17 percent) and Iran (6 percent). See “Natural Gas Production”, Enerdata World Energy & Climate Statistics - Yearbook 2023, accessed 4 September 2023, www.doi.org/yearbook.enerdata.net/natural-gas/world-natural-gas-production-statistics.html. And Statista Research Department, “Natural Gas Production Worldwide from 1998 to 2022”, Statista, 29 August 2023, www.statista.com/statistics/265344/total-global-natural-gas-production-since-1998.
-
11
RMI provides data on supply chain emissions by oil and gas project. See RMI, “Assessing Global Oil and Gas Emissions”, Oil Climate Index plus Gas, 2023, ociplus.rmi.org.
-
12
Some initiatives to capture methane emissions can have a positive net present value for companies. See Chantal Beck et al., “The Future of Oil and Gas Is Now: How Companies Can Decarbonize,” McKinsey & Company, 7 January 2020, www.mckinsey.com/industries/oil-and-gas/our-insights/the-future-is-now-how-oil-and-gas-companies-can-decarbonize.
-
13
Authors’ calculations based on Tomas de Oliveira Bredariol and Christophe McGlade, “Fossil Fuels,” IEA, 11 July 2023, www.iea.org/energy-system/fossil-fuels. And Tomas de Oliveira Bredariol and Christophe McGlade, “Gas Flaring,” IEA, accessed 15 September 2023, www.iea.org/energy-system/fossil-fuels/gas-flaring.
-
14
This is a 30 percent cut relative to 2020 levels.
-
15
Authors’ analysis based on Rebecca Schulz, Christophe McGlade, and Peter Zeniewski, “Putting Gas Flaring in the Spotlight,” IEA, 9 December 2020, www.iea.org/commentaries/putting-gas-flaring-in-the-spotlight. And “Nigeria,” The World Bank, June 2022, flaringventingregulations.worldbank.org/nigeria.
-
16
In 2022 Nigeria’s government “[I[ssued guidelines to support the elimination of routine gas flaring by 2030 and a 60 percent reduction in fugitive methane emissions by 2031.” “Methane Abatement,” IEA, accessed 2 October 2023, www.iea.org/energy-system/fossil-fuels/methane-abatement.
National Oil Companies and the Energy Transition: Looking to COP28 and Beyond
Online and in-person

National oil companies from emerging markets produce about 50 percent of the world’s oil, hold about 50 percent of global refining capacity, and own most of the world’s oil and gas reserves. With oil prices at more than USD 80/barrel, they are also generating significant oil revenues. With COP28 taking place in the United Arab Emirates, a major oil exporting country with a strong national oil company, the role of oil and gas in the energy transition, and that of national oil companies, is going to take center stage in the discussions in Dubai.
What are these companies’ decarbonization goals? What kind of investments are they making in clean energy technologies, if any? The Center on Global Energy Policy (CGEP) at Columbia University’s School of International and Public Affairs (SIPA) hosted a discussion to explore the policy and investment choices of national oil companies in the energy transition.
Moderator
- Patrick Heller, chief program officer, Natural Resource Governance Institute
Speakers
- Erica Downs, senior research scholar, Center on Global Energy Policy at Columbia SIPA
- Tatiana Mitrova, research fellow, Center on Global Energy Policy at Columbia SIPA
- Luisa Palacios, senior research scholar, Center on Global Energy Policy at Columbia SIPA
- Karen E. Young, senior research scholar, Center on Global Energy Policy at Columbia SIPA
This event took place in person in New York City and was live-streamed via Zoom.

Patrick Heller
Chief Program Officer
Notes
-
1
Authors’ analysis based on “Greenhouse Gas Emissions from Energy Data Explorer”, International Energy Agency, 2 August 2023, www.iea.org/data-and-statistics/data-tools/greenhouse-gas-emissions-from-energy-data-explorer. And Hannah Ritchie, Max Roser, and Pablo Rosado, “CO₂ and Greenhouse Gas Emissions,” Our World in Data, 2020, ourworldindata.org/co2-and-greenhouse-gas-emissions.
-
2
Authors’ calculations based on Hannah Ritchie, Pablo Rosado, and Max Roser, “Greenhouse Gas Emissions,” Our World in Data, 2020. And “Oil and Natural Gas Supply,” IEA, 2022, www.iea.org/reports/oil-and-natural-gas-supply. Quoted in African Natural Resources Management and Investment Centre, Minimising Greenhouse Gas Emissions in the Petroleum Sector: The Opportunity for Emerging Producers (Abidjan, Côte d’Ivoire: African Development Bank, 2022), 14, www.newproducersgroup.online/wp-content/uploads/2022/11/Minimising-Greenhouse-Gas-Emissions-in-the-Petroleum-Sector.pdf.
-
3
In order to ensure greater international equity in the energy transition, authorities in countries implementing schemes such as the EU’s CBAM should include, in or alongside such schemes, measures to mitigate their negative effects on low and middle-income countries, e.g., through financial and/or technical assistance to help such countries green their economies.
-
4
Methane is a common by-product of oil extraction and a particularly potent greenhouse gas. In the process of getting oil and gas out of the ground, it is commonly emitted either through leaks or planned release into the atmosphere – either unburned (“venting”) or burned (“flaring”). Processing (e.g., refining) and transporting oil and gas also generate significant emissions. See “Methane from Oil and Gas Production Explained,” The World Bank - Global Gas Flaring Reduction Partnership, accessed 24 October 2023, www.worldbank.org/en/programs/gasflaringreduction/methane-explained.
-
5
The Global Registry of Fossil Fuels is an “[O]pen-source database of oil, gas and coal production and reserves globally, expressed in CO2-equivalent… It contains data from 139 fossil fuel producing countries, which amounts to 99% of fossil fuel production aggregated to the national level.” The database also provides estimates of the emissions from producing oil and gas in 91 oil producing countries and 71 gas producers. See “Global Registry of Fossil Fuel Emissions and Reserves”, Global Registry of Fossil Fuels, accessed 4 September 2023, fossilfuelregistry.org.
-
6
Figures 1 and 2 show a selection of countries, including some of the world’s larger oil producers, some of the world’s lower emitting producers as well as a selection of countries where NRGI operates. This is intended to provide reference points to explore whether individual countries will be more or less “carbon-competitive” than other producers based on current intensities and identifying potential examples of good practice among lower emitting producers. We also include a selection of higher-emitting producers, which may provide examples of practices to avoid.
-
7
Source: “Carbon Intensity in the Fossil Fuel Supply Chain”, Global Registry of Fossil Fuels, 2023, fossilfuelregistry.org/carbon-intensity. Global Warming Potential (GWP) 20 is applied to methane emissions; see “Methane and Climate Change,” IEA, accessed 4 September 2023, www.iea.org/reports/methane-tracker-2021/methane-and-climate-change. The impact would be smaller if we used Global Warming Potential 100. The impact over the next 20 years is important and sufficient to justify action on cutting upstream emissions (and using GWP 100 would fail to show this); this is why we have chosen to display GWP 20 in this figure and figure 2. For further discussion, see Janos Maté and David Kanter, “The Benefits of Basing Policies on the 20 Year GWP of HFCs” (Greenpeace, 2011), ozone.unep.org/system/files/documents/Benefits%20of%20Basing%20Policies%20on%2020%20GWP%20of%20HFCs.pdf.
-
8
The world’s largest oil producers are the United States (accounting for 21 percent of global production), Saudi Arabia (13 percent) and Russia (10 percent). See “Frequently Asked Questions (FAQs) - What Countries Are the Top Producers and Consumers of Oil?”, U.S. Energy Information Administration (EIA), 22 September 2023, www.eia.gov/tools/faqs/faq.php?id=709&t=6.
-
9
Source: “Carbon Intensity in the Fossil Fuel Supply Chain.”
-
10
The world’s largest (fossil) gas producers are the United States (accounting for 25 percent of production), Russia (17 percent) and Iran (6 percent). See “Natural Gas Production”, Enerdata World Energy & Climate Statistics - Yearbook 2023, accessed 4 September 2023, www.doi.org/yearbook.enerdata.net/natural-gas/world-natural-gas-production-statistics.html. And Statista Research Department, “Natural Gas Production Worldwide from 1998 to 2022”, Statista, 29 August 2023, www.statista.com/statistics/265344/total-global-natural-gas-production-since-1998.
-
11
RMI provides data on supply chain emissions by oil and gas project. See RMI, “Assessing Global Oil and Gas Emissions”, Oil Climate Index plus Gas, 2023, ociplus.rmi.org.
-
12
Some initiatives to capture methane emissions can have a positive net present value for companies. See Chantal Beck et al., “The Future of Oil and Gas Is Now: How Companies Can Decarbonize,” McKinsey & Company, 7 January 2020, www.mckinsey.com/industries/oil-and-gas/our-insights/the-future-is-now-how-oil-and-gas-companies-can-decarbonize.
-
13
Authors’ calculations based on Tomas de Oliveira Bredariol and Christophe McGlade, “Fossil Fuels,” IEA, 11 July 2023, www.iea.org/energy-system/fossil-fuels. And Tomas de Oliveira Bredariol and Christophe McGlade, “Gas Flaring,” IEA, accessed 15 September 2023, www.iea.org/energy-system/fossil-fuels/gas-flaring.
-
14
This is a 30 percent cut relative to 2020 levels.
-
15
Authors’ analysis based on Rebecca Schulz, Christophe McGlade, and Peter Zeniewski, “Putting Gas Flaring in the Spotlight,” IEA, 9 December 2020, www.iea.org/commentaries/putting-gas-flaring-in-the-spotlight. And “Nigeria,” The World Bank, June 2022, flaringventingregulations.worldbank.org/nigeria.
-
16
In 2022 Nigeria’s government “[I[ssued guidelines to support the elimination of routine gas flaring by 2030 and a 60 percent reduction in fugitive methane emissions by 2031.” “Methane Abatement,” IEA, accessed 2 October 2023, www.iea.org/energy-system/fossil-fuels/methane-abatement.
The Future of Mining Taxation
Webinar

This webinar delved into how countries can adapt their mining tax policies to respond to climate change, automation, and the global tax justice movement. The event also explored the risks and opportunities these trends present for the mining sector.
Key discussion questions included:
- Are current financial benefit-sharing mechanisms (royalties and corporate income tax) fit for purpose?
- How can resource-rich countries adapt their mining tax regimes to seize opportunities and manage risks facing the sector?
- How can global tax cooperation include the mining sector (if at all)?
- How can tax policies help the mining sector to combat climate change?
Speakers included:
- Anthony Bebbington, Ford Foundation (moderator)
- William Davis, NRGI
- Mukupa Nsenduluka, Tax Justice Network – Africa
- Viola Tarus, IGF
The event is targeted primarily at civil society actors, predominantly from Africa and Latin America. Government officials are also welcome.
Notes
-
1
Authors’ analysis based on “Greenhouse Gas Emissions from Energy Data Explorer”, International Energy Agency, 2 August 2023, www.iea.org/data-and-statistics/data-tools/greenhouse-gas-emissions-from-energy-data-explorer. And Hannah Ritchie, Max Roser, and Pablo Rosado, “CO₂ and Greenhouse Gas Emissions,” Our World in Data, 2020, ourworldindata.org/co2-and-greenhouse-gas-emissions.
-
2
Authors’ calculations based on Hannah Ritchie, Pablo Rosado, and Max Roser, “Greenhouse Gas Emissions,” Our World in Data, 2020. And “Oil and Natural Gas Supply,” IEA, 2022, www.iea.org/reports/oil-and-natural-gas-supply. Quoted in African Natural Resources Management and Investment Centre, Minimising Greenhouse Gas Emissions in the Petroleum Sector: The Opportunity for Emerging Producers (Abidjan, Côte d’Ivoire: African Development Bank, 2022), 14, www.newproducersgroup.online/wp-content/uploads/2022/11/Minimising-Greenhouse-Gas-Emissions-in-the-Petroleum-Sector.pdf.
-
3
In order to ensure greater international equity in the energy transition, authorities in countries implementing schemes such as the EU’s CBAM should include, in or alongside such schemes, measures to mitigate their negative effects on low and middle-income countries, e.g., through financial and/or technical assistance to help such countries green their economies.
-
4
Methane is a common by-product of oil extraction and a particularly potent greenhouse gas. In the process of getting oil and gas out of the ground, it is commonly emitted either through leaks or planned release into the atmosphere – either unburned (“venting”) or burned (“flaring”). Processing (e.g., refining) and transporting oil and gas also generate significant emissions. See “Methane from Oil and Gas Production Explained,” The World Bank - Global Gas Flaring Reduction Partnership, accessed 24 October 2023, www.worldbank.org/en/programs/gasflaringreduction/methane-explained.
-
5
The Global Registry of Fossil Fuels is an “[O]pen-source database of oil, gas and coal production and reserves globally, expressed in CO2-equivalent… It contains data from 139 fossil fuel producing countries, which amounts to 99% of fossil fuel production aggregated to the national level.” The database also provides estimates of the emissions from producing oil and gas in 91 oil producing countries and 71 gas producers. See “Global Registry of Fossil Fuel Emissions and Reserves”, Global Registry of Fossil Fuels, accessed 4 September 2023, fossilfuelregistry.org.
-
6
Figures 1 and 2 show a selection of countries, including some of the world’s larger oil producers, some of the world’s lower emitting producers as well as a selection of countries where NRGI operates. This is intended to provide reference points to explore whether individual countries will be more or less “carbon-competitive” than other producers based on current intensities and identifying potential examples of good practice among lower emitting producers. We also include a selection of higher-emitting producers, which may provide examples of practices to avoid.
-
7
Source: “Carbon Intensity in the Fossil Fuel Supply Chain”, Global Registry of Fossil Fuels, 2023, fossilfuelregistry.org/carbon-intensity. Global Warming Potential (GWP) 20 is applied to methane emissions; see “Methane and Climate Change,” IEA, accessed 4 September 2023, www.iea.org/reports/methane-tracker-2021/methane-and-climate-change. The impact would be smaller if we used Global Warming Potential 100. The impact over the next 20 years is important and sufficient to justify action on cutting upstream emissions (and using GWP 100 would fail to show this); this is why we have chosen to display GWP 20 in this figure and figure 2. For further discussion, see Janos Maté and David Kanter, “The Benefits of Basing Policies on the 20 Year GWP of HFCs” (Greenpeace, 2011), ozone.unep.org/system/files/documents/Benefits%20of%20Basing%20Policies%20on%2020%20GWP%20of%20HFCs.pdf.
-
8
The world’s largest oil producers are the United States (accounting for 21 percent of global production), Saudi Arabia (13 percent) and Russia (10 percent). See “Frequently Asked Questions (FAQs) - What Countries Are the Top Producers and Consumers of Oil?”, U.S. Energy Information Administration (EIA), 22 September 2023, www.eia.gov/tools/faqs/faq.php?id=709&t=6.
-
9
Source: “Carbon Intensity in the Fossil Fuel Supply Chain.”
-
10
The world’s largest (fossil) gas producers are the United States (accounting for 25 percent of production), Russia (17 percent) and Iran (6 percent). See “Natural Gas Production”, Enerdata World Energy & Climate Statistics - Yearbook 2023, accessed 4 September 2023, www.doi.org/yearbook.enerdata.net/natural-gas/world-natural-gas-production-statistics.html. And Statista Research Department, “Natural Gas Production Worldwide from 1998 to 2022”, Statista, 29 August 2023, www.statista.com/statistics/265344/total-global-natural-gas-production-since-1998.
-
11
RMI provides data on supply chain emissions by oil and gas project. See RMI, “Assessing Global Oil and Gas Emissions”, Oil Climate Index plus Gas, 2023, ociplus.rmi.org.
-
12
Some initiatives to capture methane emissions can have a positive net present value for companies. See Chantal Beck et al., “The Future of Oil and Gas Is Now: How Companies Can Decarbonize,” McKinsey & Company, 7 January 2020, www.mckinsey.com/industries/oil-and-gas/our-insights/the-future-is-now-how-oil-and-gas-companies-can-decarbonize.
-
13
Authors’ calculations based on Tomas de Oliveira Bredariol and Christophe McGlade, “Fossil Fuels,” IEA, 11 July 2023, www.iea.org/energy-system/fossil-fuels. And Tomas de Oliveira Bredariol and Christophe McGlade, “Gas Flaring,” IEA, accessed 15 September 2023, www.iea.org/energy-system/fossil-fuels/gas-flaring.
-
14
This is a 30 percent cut relative to 2020 levels.
-
15
Authors’ analysis based on Rebecca Schulz, Christophe McGlade, and Peter Zeniewski, “Putting Gas Flaring in the Spotlight,” IEA, 9 December 2020, www.iea.org/commentaries/putting-gas-flaring-in-the-spotlight. And “Nigeria,” The World Bank, June 2022, flaringventingregulations.worldbank.org/nigeria.
-
16
In 2022 Nigeria’s government “[I[ssued guidelines to support the elimination of routine gas flaring by 2030 and a 60 percent reduction in fugitive methane emissions by 2031.” “Methane Abatement,” IEA, accessed 2 October 2023, www.iea.org/energy-system/fossil-fuels/methane-abatement.
Managing Senegal’s Oil and Gas Revenues

Key messages
- The oil and gas sector it is not expected to transform Senegal’s economy or public finances. Fields that have received a final investment decision are are unlikely to generate revenues over 3 percent of GDP.
- Senegal already possesses some of the institutions needed to promote good revenue management of oil and gas revenues, including: (1) a relatively transparent and comprehensive annual budgeting process; (2) robust compliance with Extractive Industries Transparency Initiative (EITI) standards; (3) a relatively free and vibrant media.
- Given Senegal’s acute domestic investment needs, the government’s new sovereign wealth fund proposal may be ill-timed. Such funds are not the best vehicle for investing natural resource wealth domestically. Instead, the government should consider investing these funds through the budget. It could also be advisable to employ an expenditure rule limiting government spending, or a non-resource current balance rule preventing governments from squandering resource revenues by running a deficit in other areas, combined with a capital expenditure growth rule to mandate investment.
- The national oil company, PETROSEN’s debt accumulation and revenue retention pose significant risks for public finances over the coming years. The government should consider strengthening oversight of PETROSEN, for instance by appointing independent board members, publishing independent audits and clarifying the company’s dividend policy.
- Some fishing communities in Senegal are concerned about the impact of oil and gas projects on their livelihoods. If these negative impacts are confirmed, the authors of this report recommend that the government consider compensation through environmental and social management plans, as opposed to allocating a fixed share of resource revenues to sub-national governments.
Notes
-
1
Authors’ analysis based on “Greenhouse Gas Emissions from Energy Data Explorer”, International Energy Agency, 2 August 2023, www.iea.org/data-and-statistics/data-tools/greenhouse-gas-emissions-from-energy-data-explorer. And Hannah Ritchie, Max Roser, and Pablo Rosado, “CO₂ and Greenhouse Gas Emissions,” Our World in Data, 2020, ourworldindata.org/co2-and-greenhouse-gas-emissions.
-
2
Authors’ calculations based on Hannah Ritchie, Pablo Rosado, and Max Roser, “Greenhouse Gas Emissions,” Our World in Data, 2020. And “Oil and Natural Gas Supply,” IEA, 2022, www.iea.org/reports/oil-and-natural-gas-supply. Quoted in African Natural Resources Management and Investment Centre, Minimising Greenhouse Gas Emissions in the Petroleum Sector: The Opportunity for Emerging Producers (Abidjan, Côte d’Ivoire: African Development Bank, 2022), 14, www.newproducersgroup.online/wp-content/uploads/2022/11/Minimising-Greenhouse-Gas-Emissions-in-the-Petroleum-Sector.pdf.
-
3
In order to ensure greater international equity in the energy transition, authorities in countries implementing schemes such as the EU’s CBAM should include, in or alongside such schemes, measures to mitigate their negative effects on low and middle-income countries, e.g., through financial and/or technical assistance to help such countries green their economies.
-
4
Methane is a common by-product of oil extraction and a particularly potent greenhouse gas. In the process of getting oil and gas out of the ground, it is commonly emitted either through leaks or planned release into the atmosphere – either unburned (“venting”) or burned (“flaring”). Processing (e.g., refining) and transporting oil and gas also generate significant emissions. See “Methane from Oil and Gas Production Explained,” The World Bank - Global Gas Flaring Reduction Partnership, accessed 24 October 2023, www.worldbank.org/en/programs/gasflaringreduction/methane-explained.
-
5
The Global Registry of Fossil Fuels is an “[O]pen-source database of oil, gas and coal production and reserves globally, expressed in CO2-equivalent… It contains data from 139 fossil fuel producing countries, which amounts to 99% of fossil fuel production aggregated to the national level.” The database also provides estimates of the emissions from producing oil and gas in 91 oil producing countries and 71 gas producers. See “Global Registry of Fossil Fuel Emissions and Reserves”, Global Registry of Fossil Fuels, accessed 4 September 2023, fossilfuelregistry.org.
-
6
Figures 1 and 2 show a selection of countries, including some of the world’s larger oil producers, some of the world’s lower emitting producers as well as a selection of countries where NRGI operates. This is intended to provide reference points to explore whether individual countries will be more or less “carbon-competitive” than other producers based on current intensities and identifying potential examples of good practice among lower emitting producers. We also include a selection of higher-emitting producers, which may provide examples of practices to avoid.
-
7
Source: “Carbon Intensity in the Fossil Fuel Supply Chain”, Global Registry of Fossil Fuels, 2023, fossilfuelregistry.org/carbon-intensity. Global Warming Potential (GWP) 20 is applied to methane emissions; see “Methane and Climate Change,” IEA, accessed 4 September 2023, www.iea.org/reports/methane-tracker-2021/methane-and-climate-change. The impact would be smaller if we used Global Warming Potential 100. The impact over the next 20 years is important and sufficient to justify action on cutting upstream emissions (and using GWP 100 would fail to show this); this is why we have chosen to display GWP 20 in this figure and figure 2. For further discussion, see Janos Maté and David Kanter, “The Benefits of Basing Policies on the 20 Year GWP of HFCs” (Greenpeace, 2011), ozone.unep.org/system/files/documents/Benefits%20of%20Basing%20Policies%20on%2020%20GWP%20of%20HFCs.pdf.
-
8
The world’s largest oil producers are the United States (accounting for 21 percent of global production), Saudi Arabia (13 percent) and Russia (10 percent). See “Frequently Asked Questions (FAQs) - What Countries Are the Top Producers and Consumers of Oil?”, U.S. Energy Information Administration (EIA), 22 September 2023, www.eia.gov/tools/faqs/faq.php?id=709&t=6.
-
9
Source: “Carbon Intensity in the Fossil Fuel Supply Chain.”
-
10
The world’s largest (fossil) gas producers are the United States (accounting for 25 percent of production), Russia (17 percent) and Iran (6 percent). See “Natural Gas Production”, Enerdata World Energy & Climate Statistics - Yearbook 2023, accessed 4 September 2023, www.doi.org/yearbook.enerdata.net/natural-gas/world-natural-gas-production-statistics.html. And Statista Research Department, “Natural Gas Production Worldwide from 1998 to 2022”, Statista, 29 August 2023, www.statista.com/statistics/265344/total-global-natural-gas-production-since-1998.
-
11
RMI provides data on supply chain emissions by oil and gas project. See RMI, “Assessing Global Oil and Gas Emissions”, Oil Climate Index plus Gas, 2023, ociplus.rmi.org.
-
12
Some initiatives to capture methane emissions can have a positive net present value for companies. See Chantal Beck et al., “The Future of Oil and Gas Is Now: How Companies Can Decarbonize,” McKinsey & Company, 7 January 2020, www.mckinsey.com/industries/oil-and-gas/our-insights/the-future-is-now-how-oil-and-gas-companies-can-decarbonize.
-
13
Authors’ calculations based on Tomas de Oliveira Bredariol and Christophe McGlade, “Fossil Fuels,” IEA, 11 July 2023, www.iea.org/energy-system/fossil-fuels. And Tomas de Oliveira Bredariol and Christophe McGlade, “Gas Flaring,” IEA, accessed 15 September 2023, www.iea.org/energy-system/fossil-fuels/gas-flaring.
-
14
This is a 30 percent cut relative to 2020 levels.
-
15
Authors’ analysis based on Rebecca Schulz, Christophe McGlade, and Peter Zeniewski, “Putting Gas Flaring in the Spotlight,” IEA, 9 December 2020, www.iea.org/commentaries/putting-gas-flaring-in-the-spotlight. And “Nigeria,” The World Bank, June 2022, flaringventingregulations.worldbank.org/nigeria.
-
16
In 2022 Nigeria’s government “[I[ssued guidelines to support the elimination of routine gas flaring by 2030 and a 60 percent reduction in fugitive methane emissions by 2031.” “Methane Abatement,” IEA, accessed 2 October 2023, www.iea.org/energy-system/fossil-fuels/methane-abatement.
CSDD Directive: Is the EU Opening the Door for Corruption?

In her September State of the Union address, European Commission President Ursula von der Leyen was unequivocal about the harm corruption inflicts on democracies.
“Corruption erodes trust in our institutions. So we must fight back with the full force of the law,” she said.
Combating corruption would be at the forefront of the Commission’s legislative agenda in the coming year, she added. Central to this agenda is transforming the impact that EU companies have on the planet.
The European Commission has recently initiated a raft of new laws spanning different areas – but all with the same broad aim of ensuring that EU companies are not complicit in environmental or human rights abuses around the world.
From a historic regulation requiring companies to prove that their supply chains aren’t fueling global deforestation to a directive forcing companies to disclose their businesses’ social and environmental impacts, the momentum for companies operating out of the world’s largest trading bloc to behave responsibly and sustainably is growing – and has overwhelming public support.
A key weapon in this growing legislative armoury is the Corporate Sustainability Due Diligence Directive (CSDDD).
The proposed CSDDD text published by the European Commission earlier this year will require company directors to take into account the human rights, climate and environmental impacts of their businesses. It will apply not just to a company’s own operations, but its subsidiaries and supply chains, including direct and indirect business relationships.
The CSDDD is a potentially critical tool in tackling the damage caused by the extractive industries – which are responsible for half of the world’s carbon emissions and more than 80% of biodiversity loss. It could also help underpin the reforms needed for a just energy transition.
A breeding ground for corruption
Yet, as it stands, the proposed CSDDD has a glaring omission, which could undermine its effectiveness. Unlike other legislation the EU is pushing through to ensure its businesses behave responsibly around the world, the CSDDD proposal places no due diligence requirements on companies to tackle corruption.
This matters because corruption is often inextricably linked to human rights and environmental abuses. The absence of anti-corruption safeguards in its due diligence requirements can also have grave implications for energy and national security.
Corruption is more prevalent in the extractives sector than any other: one in five transnational bribery cases involve extractives, and corruption often aggravates environmental, social, and human rights abuses.
Meanwhile, Russia’s assault on Ukraine – and the energy crisis it has precipitated – has brutally exposed the perils of doing business with corrupt, kleptocratic and autocratic regimes.
There are reports that European and US energy companies and commodity traders, including BP, Shell, Wintershall Dea, ExxonMobil, TotalEnergies, Equinor, OMV, and Trafigura, have contributed over $95 billion to the Russian government via oil and gas projects since the invasion of Crimea in 2014.
Until August 2022, TotalEnergies held a 49% stake in a Russian gas field that allegedly provides fuel that ends up in Russian fighter jets. Investigators traced the Kerosene supply chain of two military bases, Morozovskaya and Malshevo, to the gas field in Siberia which TotalEnergies co-owned.
Global Witness has also identified that BP will net an estimated £580 million this year from its nearly 20% stake in Rosneft, which it still holds despite promises to sell earlier this year.
Beyond Russia’s invasion of Ukraine, corruption has contributed to instability in many other parts of the world – and will continue to do so unless governments – with the help of international and regional institutions, and in collaboration with civil society – commit to more integrity, transparency and accountability along with strong and enforceable anticorruption policies.
Among the legion of examples, is the elite capture of South Sudan’s state-owned oil company, which helped divert oil revenues to security services and militias accused of serious human rights abuses. In Libya, the illicit trade of oil and gas directly funded armed groups, including those responsible for trafficking migrants across the Mediterranean.
Corruption breeds conditions that lead to social and political unrest, as well as environmental destruction. It deters responsible investment, and diverts revenues away from the public purse, preventing communities and populations from benefiting from such investments.
The world is moving to a low-carbon future, and demand for the minerals used in green technology is skyrocketing. In this context, tackling the corruption that has blighted the extractive sector for so long is more crucial than ever. The CSDDD can and should play a role.
To do so, however, it is vital that EU legislators strengthen the directive with specific governance and anti-corruption requirements: by adding a definition of ‘adverse governance impacts’ and including key anti-corruption conventions in the Directive’s Annex, they can boost the CSDDD’s ability to foster resilient and sustainable value chains in key high-risk economic sectors such as oil, gas and mining. With some amendments down on these issues, there is still hope.
The case for doing so is clear cut, the benefits potentially immense. On International Anti-Corruption Day, and in the year which marks the 20th anniversary of the UN Convention against Corruption, the time is well overdue for governments, the private sector and EU legislators to live up to their commitments – and translate Ursula von der Leyen’s fine words into action.
Originally published on the Euractiv website.
Notes
-
1
Authors’ analysis based on “Greenhouse Gas Emissions from Energy Data Explorer”, International Energy Agency, 2 August 2023, www.iea.org/data-and-statistics/data-tools/greenhouse-gas-emissions-from-energy-data-explorer. And Hannah Ritchie, Max Roser, and Pablo Rosado, “CO₂ and Greenhouse Gas Emissions,” Our World in Data, 2020, ourworldindata.org/co2-and-greenhouse-gas-emissions.
-
2
Authors’ calculations based on Hannah Ritchie, Pablo Rosado, and Max Roser, “Greenhouse Gas Emissions,” Our World in Data, 2020. And “Oil and Natural Gas Supply,” IEA, 2022, www.iea.org/reports/oil-and-natural-gas-supply. Quoted in African Natural Resources Management and Investment Centre, Minimising Greenhouse Gas Emissions in the Petroleum Sector: The Opportunity for Emerging Producers (Abidjan, Côte d’Ivoire: African Development Bank, 2022), 14, www.newproducersgroup.online/wp-content/uploads/2022/11/Minimising-Greenhouse-Gas-Emissions-in-the-Petroleum-Sector.pdf.
-
3
In order to ensure greater international equity in the energy transition, authorities in countries implementing schemes such as the EU’s CBAM should include, in or alongside such schemes, measures to mitigate their negative effects on low and middle-income countries, e.g., through financial and/or technical assistance to help such countries green their economies.
-
4
Methane is a common by-product of oil extraction and a particularly potent greenhouse gas. In the process of getting oil and gas out of the ground, it is commonly emitted either through leaks or planned release into the atmosphere – either unburned (“venting”) or burned (“flaring”). Processing (e.g., refining) and transporting oil and gas also generate significant emissions. See “Methane from Oil and Gas Production Explained,” The World Bank - Global Gas Flaring Reduction Partnership, accessed 24 October 2023, www.worldbank.org/en/programs/gasflaringreduction/methane-explained.
-
5
The Global Registry of Fossil Fuels is an “[O]pen-source database of oil, gas and coal production and reserves globally, expressed in CO2-equivalent… It contains data from 139 fossil fuel producing countries, which amounts to 99% of fossil fuel production aggregated to the national level.” The database also provides estimates of the emissions from producing oil and gas in 91 oil producing countries and 71 gas producers. See “Global Registry of Fossil Fuel Emissions and Reserves”, Global Registry of Fossil Fuels, accessed 4 September 2023, fossilfuelregistry.org.
-
6
Figures 1 and 2 show a selection of countries, including some of the world’s larger oil producers, some of the world’s lower emitting producers as well as a selection of countries where NRGI operates. This is intended to provide reference points to explore whether individual countries will be more or less “carbon-competitive” than other producers based on current intensities and identifying potential examples of good practice among lower emitting producers. We also include a selection of higher-emitting producers, which may provide examples of practices to avoid.
-
7
Source: “Carbon Intensity in the Fossil Fuel Supply Chain”, Global Registry of Fossil Fuels, 2023, fossilfuelregistry.org/carbon-intensity. Global Warming Potential (GWP) 20 is applied to methane emissions; see “Methane and Climate Change,” IEA, accessed 4 September 2023, www.iea.org/reports/methane-tracker-2021/methane-and-climate-change. The impact would be smaller if we used Global Warming Potential 100. The impact over the next 20 years is important and sufficient to justify action on cutting upstream emissions (and using GWP 100 would fail to show this); this is why we have chosen to display GWP 20 in this figure and figure 2. For further discussion, see Janos Maté and David Kanter, “The Benefits of Basing Policies on the 20 Year GWP of HFCs” (Greenpeace, 2011), ozone.unep.org/system/files/documents/Benefits%20of%20Basing%20Policies%20on%2020%20GWP%20of%20HFCs.pdf.
-
8
The world’s largest oil producers are the United States (accounting for 21 percent of global production), Saudi Arabia (13 percent) and Russia (10 percent). See “Frequently Asked Questions (FAQs) - What Countries Are the Top Producers and Consumers of Oil?”, U.S. Energy Information Administration (EIA), 22 September 2023, www.eia.gov/tools/faqs/faq.php?id=709&t=6.
-
9
Source: “Carbon Intensity in the Fossil Fuel Supply Chain.”
-
10
The world’s largest (fossil) gas producers are the United States (accounting for 25 percent of production), Russia (17 percent) and Iran (6 percent). See “Natural Gas Production”, Enerdata World Energy & Climate Statistics - Yearbook 2023, accessed 4 September 2023, www.doi.org/yearbook.enerdata.net/natural-gas/world-natural-gas-production-statistics.html. And Statista Research Department, “Natural Gas Production Worldwide from 1998 to 2022”, Statista, 29 August 2023, www.statista.com/statistics/265344/total-global-natural-gas-production-since-1998.
-
11
RMI provides data on supply chain emissions by oil and gas project. See RMI, “Assessing Global Oil and Gas Emissions”, Oil Climate Index plus Gas, 2023, ociplus.rmi.org.
-
12
Some initiatives to capture methane emissions can have a positive net present value for companies. See Chantal Beck et al., “The Future of Oil and Gas Is Now: How Companies Can Decarbonize,” McKinsey & Company, 7 January 2020, www.mckinsey.com/industries/oil-and-gas/our-insights/the-future-is-now-how-oil-and-gas-companies-can-decarbonize.
-
13
Authors’ calculations based on Tomas de Oliveira Bredariol and Christophe McGlade, “Fossil Fuels,” IEA, 11 July 2023, www.iea.org/energy-system/fossil-fuels. And Tomas de Oliveira Bredariol and Christophe McGlade, “Gas Flaring,” IEA, accessed 15 September 2023, www.iea.org/energy-system/fossil-fuels/gas-flaring.
-
14
This is a 30 percent cut relative to 2020 levels.
-
15
Authors’ analysis based on Rebecca Schulz, Christophe McGlade, and Peter Zeniewski, “Putting Gas Flaring in the Spotlight,” IEA, 9 December 2020, www.iea.org/commentaries/putting-gas-flaring-in-the-spotlight. And “Nigeria,” The World Bank, June 2022, flaringventingregulations.worldbank.org/nigeria.
-
16
In 2022 Nigeria’s government “[I[ssued guidelines to support the elimination of routine gas flaring by 2030 and a 60 percent reduction in fugitive methane emissions by 2031.” “Methane Abatement,” IEA, accessed 2 October 2023, www.iea.org/energy-system/fossil-fuels/methane-abatement.
Constellation of Crises: Why Tackling Extractive-Sector Corruption Is Crucial in 2023

Corruption has plagued many resource-rich countries for decades, yet a constellation of crises requires renewed focus on the fight against corruption in 2023. A boom in demand for transition minerals that underpin renewable technologies poses major corruption risks, while actors with vested interests in fossil fuels stand in the way of a greener future. At the same time, kleptocrats in resource-rich countries continue to threaten democracy and security.
A boom in transition minerals poses major corruption risks
The International Energy Agency (IEA) projects that meeting Paris Agreement goals will require at least a quadrupling by 2040 of demand for minerals used in technologies like solar panels, wind turbines and electric vehicles. We know that past commodity booms have unleashed large waves of corruption. Fast-paced dealmaking and the promise of soaring profits serve to increase the risk tolerance of private and public sector actors alike—all while regulators struggle to keep up. The history of mining is already riddled with injustice, by which elites have grown richer at the expense of local communities and nature. And large amounts of key minerals are in countries that rank poorly on Transparency International’s Corruption Perceptions Index. Action is needed now to address these burgeoning corruption risks, which threaten to both disrupt transition mineral supply and hinder a just energy transition. USAID administrator Samantha Power, IEA, the OECD and others have recognized that these minerals may become an even more significant node of corruption in the future.
Actors with vested interests in fossil fuels may derail effective climate action
Global Witness found that fossil fuel lobbyists at COP27 outnumbered the representatives of the ten nations most impacted by the climate crisis. Research from Influence Map has shown that the five largest publicly traded oil and gas companies spent over USD 1 billion on misleading climate-related branding and lobbying in the three years following the 2015 Paris Agreement.
Actors with vested interests in fossil fuels may seek to manipulate or influence energy transition policies and practices
Yet undue influence risks extend beyond international oil companies; some national oil companies (NOCs) are susceptible to being used by corrupt ruling elites for their own personal or political benefits, creating particular risks that we have identified in targeted guidance. Actors with vested interests in fossil fuels may seek to manipulate or influence energy transition policies and practices (thanks to the opacity of government decision-making around energy transition policies and public subsidies) in ways that advance their own private interests but fail to protect the wellbeing of the country’s population or the global interest of avoiding climate disaster. NOCs produce half of the world’s oil and gas, and are responsible for 40 percent of capital investment in the global oil and gas industry. At NRGI we found that NOCs planned to invest more than $400 billion in costly oil and gas projects that will break even only if humanity exceeds its emissions targets and allows the global temperature to rise more than 2 degrees Celsius.
Resource-rich kleptocrats threaten democracy and security
Countries with authoritarian regimes produce much of the world’s oil, with these revenues propping up kleptocratic actors across the world. Russia’s war on Ukraine has shown the devastating impact of such regimes, and the ways in which natural resource wealth can often power conflict and aggression. Some of the best-known Russian oligarchs made their fortunes in the natural resource sectors, often enabled by European and U.S. energy companies and commodity traders that have turned a blind eye to Putin’s aggression. BP, Royal Dutch Shell, Wintershall Dea, ExxonMobil, TotalEnergies, Equinor, OMV and Trafigura have contributed over $95 billion to the Russian government via oil and gas projects since the invasion of Crimea in 2014. Combatting kleptocrats will be impossible without concerted action to address the source of their power: expropriated natural resource wealth. And this is not limited to the oil sector. Minerals have helped fuel conflict and authoritarianism in countries like the Democratic Republic of the Congo, Myanmar, Sierra Leone and Sudan, often aided by private military contractors such as the Wagner Group.
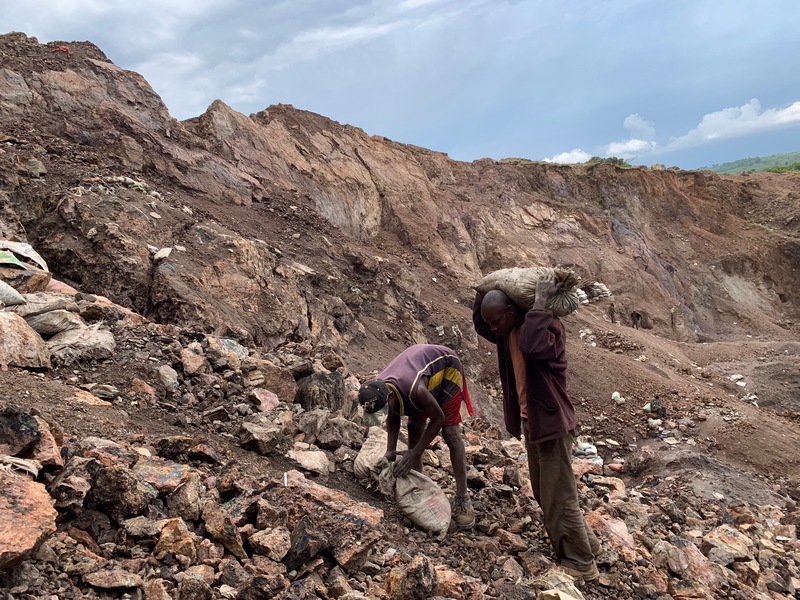
Call to action: Where next for anticorruption efforts in 2023?
Amid these challenges—as well as rising poverty and inequality—a concerted effort to tackle natural resource corruption is needed now more than ever. Transnational problems require transnational solutions, so cooperation will be key in the efforts to squeeze the space for corrupt actors to operate. There are important efforts to work together across civil society to tackle the many ways in which corruption can harm the planet, with a growing network of campaigners working to ensure integrity in climate governance and finance and taking on illegal logging and wildlife trafficking.
But unfortunately key decisionmakers are missing opportunities. They’re wavering on legislation to strengthen corporate due diligence, and backsliding on key anticorruption achievements such as public registers of beneficial ownership information.
To tackle extractive-sector corruption head-on, government officials, international organizations, aid donors, and activists from the anticorruption, extractives governance and climate communities should together push for stronger rules and enforcement, better community engagement, and crackdowns on actors with vested interests in fossil fuels and all those who enable them.
In 2023, NRGI will continue to work closely with our partners in the anticorruption space to support these efforts through:
- Advocating to governments, businesses, investors and international organizations on the need to tackle corruption in the transition mineral sector, using recommendations NRGI developed alongside experts from around the world and key opportunities like the EU Critical Raw Materials Act.
- Supporting stakeholders in resource-rich countries (including Chile, DRC and Guinea) to tackle corruption with our Corruption Diagnostic Tool, highlighting lessons from pilot projects, and publishing new modules on topics such as artisanal and small-scale mining and actors with vested interested in fossil fuels.
- Identifying key studies to better understand how actors with vested interests in fossil fuel production within and around NOCs may unduly influence policies and practices around energy transition at the national level for their own benefits and at the expense of climate action for the public interest.
This post is adapted from opening remarks made by NRGI president and CEO Suneeta Kaimal during a plenary session at the International Anti-Corruption Conference (IACC) in Washington, D.C. in December 2022.
Notes
-
1
Authors’ analysis based on “Greenhouse Gas Emissions from Energy Data Explorer”, International Energy Agency, 2 August 2023, www.iea.org/data-and-statistics/data-tools/greenhouse-gas-emissions-from-energy-data-explorer. And Hannah Ritchie, Max Roser, and Pablo Rosado, “CO₂ and Greenhouse Gas Emissions,” Our World in Data, 2020, ourworldindata.org/co2-and-greenhouse-gas-emissions.
-
2
Authors’ calculations based on Hannah Ritchie, Pablo Rosado, and Max Roser, “Greenhouse Gas Emissions,” Our World in Data, 2020. And “Oil and Natural Gas Supply,” IEA, 2022, www.iea.org/reports/oil-and-natural-gas-supply. Quoted in African Natural Resources Management and Investment Centre, Minimising Greenhouse Gas Emissions in the Petroleum Sector: The Opportunity for Emerging Producers (Abidjan, Côte d’Ivoire: African Development Bank, 2022), 14, www.newproducersgroup.online/wp-content/uploads/2022/11/Minimising-Greenhouse-Gas-Emissions-in-the-Petroleum-Sector.pdf.
-
3
In order to ensure greater international equity in the energy transition, authorities in countries implementing schemes such as the EU’s CBAM should include, in or alongside such schemes, measures to mitigate their negative effects on low and middle-income countries, e.g., through financial and/or technical assistance to help such countries green their economies.
-
4
Methane is a common by-product of oil extraction and a particularly potent greenhouse gas. In the process of getting oil and gas out of the ground, it is commonly emitted either through leaks or planned release into the atmosphere – either unburned (“venting”) or burned (“flaring”). Processing (e.g., refining) and transporting oil and gas also generate significant emissions. See “Methane from Oil and Gas Production Explained,” The World Bank - Global Gas Flaring Reduction Partnership, accessed 24 October 2023, www.worldbank.org/en/programs/gasflaringreduction/methane-explained.
-
5
The Global Registry of Fossil Fuels is an “[O]pen-source database of oil, gas and coal production and reserves globally, expressed in CO2-equivalent… It contains data from 139 fossil fuel producing countries, which amounts to 99% of fossil fuel production aggregated to the national level.” The database also provides estimates of the emissions from producing oil and gas in 91 oil producing countries and 71 gas producers. See “Global Registry of Fossil Fuel Emissions and Reserves”, Global Registry of Fossil Fuels, accessed 4 September 2023, fossilfuelregistry.org.
-
6
Figures 1 and 2 show a selection of countries, including some of the world’s larger oil producers, some of the world’s lower emitting producers as well as a selection of countries where NRGI operates. This is intended to provide reference points to explore whether individual countries will be more or less “carbon-competitive” than other producers based on current intensities and identifying potential examples of good practice among lower emitting producers. We also include a selection of higher-emitting producers, which may provide examples of practices to avoid.
-
7
Source: “Carbon Intensity in the Fossil Fuel Supply Chain”, Global Registry of Fossil Fuels, 2023, fossilfuelregistry.org/carbon-intensity. Global Warming Potential (GWP) 20 is applied to methane emissions; see “Methane and Climate Change,” IEA, accessed 4 September 2023, www.iea.org/reports/methane-tracker-2021/methane-and-climate-change. The impact would be smaller if we used Global Warming Potential 100. The impact over the next 20 years is important and sufficient to justify action on cutting upstream emissions (and using GWP 100 would fail to show this); this is why we have chosen to display GWP 20 in this figure and figure 2. For further discussion, see Janos Maté and David Kanter, “The Benefits of Basing Policies on the 20 Year GWP of HFCs” (Greenpeace, 2011), ozone.unep.org/system/files/documents/Benefits%20of%20Basing%20Policies%20on%2020%20GWP%20of%20HFCs.pdf.
-
8
The world’s largest oil producers are the United States (accounting for 21 percent of global production), Saudi Arabia (13 percent) and Russia (10 percent). See “Frequently Asked Questions (FAQs) - What Countries Are the Top Producers and Consumers of Oil?”, U.S. Energy Information Administration (EIA), 22 September 2023, www.eia.gov/tools/faqs/faq.php?id=709&t=6.
-
9
Source: “Carbon Intensity in the Fossil Fuel Supply Chain.”
-
10
The world’s largest (fossil) gas producers are the United States (accounting for 25 percent of production), Russia (17 percent) and Iran (6 percent). See “Natural Gas Production”, Enerdata World Energy & Climate Statistics - Yearbook 2023, accessed 4 September 2023, www.doi.org/yearbook.enerdata.net/natural-gas/world-natural-gas-production-statistics.html. And Statista Research Department, “Natural Gas Production Worldwide from 1998 to 2022”, Statista, 29 August 2023, www.statista.com/statistics/265344/total-global-natural-gas-production-since-1998.
-
11
RMI provides data on supply chain emissions by oil and gas project. See RMI, “Assessing Global Oil and Gas Emissions”, Oil Climate Index plus Gas, 2023, ociplus.rmi.org.
-
12
Some initiatives to capture methane emissions can have a positive net present value for companies. See Chantal Beck et al., “The Future of Oil and Gas Is Now: How Companies Can Decarbonize,” McKinsey & Company, 7 January 2020, www.mckinsey.com/industries/oil-and-gas/our-insights/the-future-is-now-how-oil-and-gas-companies-can-decarbonize.
-
13
Authors’ calculations based on Tomas de Oliveira Bredariol and Christophe McGlade, “Fossil Fuels,” IEA, 11 July 2023, www.iea.org/energy-system/fossil-fuels. And Tomas de Oliveira Bredariol and Christophe McGlade, “Gas Flaring,” IEA, accessed 15 September 2023, www.iea.org/energy-system/fossil-fuels/gas-flaring.
-
14
This is a 30 percent cut relative to 2020 levels.
-
15
Authors’ analysis based on Rebecca Schulz, Christophe McGlade, and Peter Zeniewski, “Putting Gas Flaring in the Spotlight,” IEA, 9 December 2020, www.iea.org/commentaries/putting-gas-flaring-in-the-spotlight. And “Nigeria,” The World Bank, June 2022, flaringventingregulations.worldbank.org/nigeria.
-
16
In 2022 Nigeria’s government “[I[ssued guidelines to support the elimination of routine gas flaring by 2030 and a 60 percent reduction in fugitive methane emissions by 2031.” “Methane Abatement,” IEA, accessed 2 October 2023, www.iea.org/energy-system/fossil-fuels/methane-abatement.